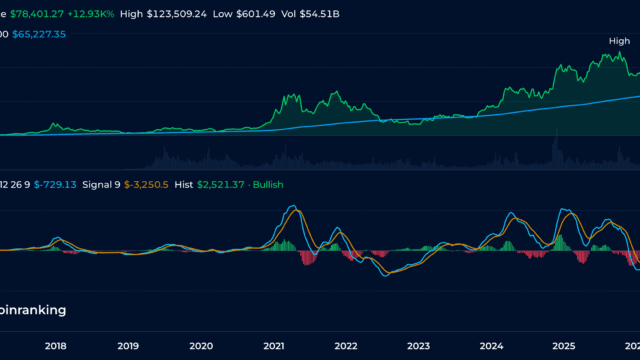
Anyone watching Bitcoin this year has seen the same pattern play out. A climb to fresh highs, a stretch of euphoria, then quiet. Not the exciting kind either. The market has settled into something more measured, and that shift has left a lot of people asking the same question in different ways. Is this just a pause, or something that sticks around longer?
The drawdown from those late-2025 peaks tested plenty of conviction. Portfolios that looked brilliant in November started looking a lot more ordinary by spring. But here’s the thing, underneath the noise there are actual signals worth watching. ETF flows, on-chain data, cycle history, all of it points toward a clearer picture than headlines alone tend to offer.
Tracking Bitcoin’s Price Action Through Mid-2026
Bitcoin price spent the first half of the year working through a pullback that started at its late-2025 peak near $126,000. By mid-year, prices were hovering in the low-to-mid $60,000s, roughly a 30% decline from those highs during some stretches. Not a collapse, exactly, but enough to sting for anyone who bought near the top, and enough to leave Bitcoin underperforming a fair number of traditional assets during that window.
This cycle has felt different for a lot of participants. Volatility has compressed compared to prior corrections, and institutional participation adjusted rather than disappeared, according to reporting from Coinpedia. Nobody packed up and left the room. They just moved toward the exits a little more slowly, and some are already drifting back in.
ETF Flows Reveal Institutional Liquidity Shifts
Spot Bitcoin ETFs became the go-to barometer for institutional sentiment almost the moment they launched, and the mid-2026 numbers tell a story that’s part reversal, part adaptation. A few data points stand out:
- June alone produced roughly $4.06 billion in net outflows from U.S. spot Bitcoin ETFs, the largest monthly redemption on record according to CoinDesk.
- Year-to-date outflows through the first half of 2026 reached about $5 billion.
- One rough stretch saw over $4.4 billion in redemptions across 13 consecutive days before even a modest inflow showed up.
- Weekly outflows exceeded $1.3 billion in some stretches, with BlackRock’s IBIT playing a leading role in one of its longest outflow runs since launch, according to Bloomberg.
These outflows lined up with a broader rotation of capital toward sectors like AI equities, and Talos research points out that Bitcoin ETFs are increasingly behaving like established risk assets inside institutional portfolios. A few years ago, nobody was rotating out of Bitcoin into semiconductor stocks. Now it’s just another line item on the risk budget.
On-Chain Metrics Highlight Prolonged Deep Value
Exchange-traded products only tell part of the story. Blockchain data offers a ground-level view of what actual holders are doing. Analysis from Glassnode around mid-July 2026 found that Bitcoin had spent roughly five months trading below both its True Market Mean, near $76,600, and the Short-Term Holder Cost Basis, near $72,200.
Five months is a long time to sit below those thresholds. Long-term holder realized losses reached peaks near $280 million per day, the highest since late 2022, accounting for about 43% of total realized value in recent readings. That kind of capitulation isn’t fun to watch, but it often forms part of the groundwork for cyclical bottoms. The process rarely feels clean while it’s happening, and the current readings suggest this one is closer to its later innings than its beginning.
Cycle Patterns Show Compression and Evolution
The old four-year halving cycle framework still offers useful context, but recent evidence suggests things are evolving in scale. Research published by Galaxy Digital in June 2026 found that drawdowns have moderated compared with earlier cycles. The move down from the October 2025 peak sat around 51% after roughly eight months, at the time that analysis was published.
Tops have gotten calmer too. Lower MVRV ratios at recent peaks suggest institutional participation has smoothed out some of the wild extremes that defined earlier cycles, which could mean shallower bottoms down the road. Commentary tied to Real Vision’s Jamie Coutts noted that while trend indicators remained technically bearish, longer timeframes were showing signs of decelerating negative momentum, consistent with a market working through the later stretch of a cooldown rather than an early panic phase.
Corporate Treasury Strategies Face Real Pressure
Public companies that built out Bitcoin treasuries got a real test of conviction during the correction. Reuters reporting from early February 2026 captured shares of several such firms dropping sharply, with some seeing double-digit declines in single trading sessions alongside Bitcoin’s own move lower.
One analyst described the environment at the time as full capitulation mode, adding that these transitions historically play out over months, not weeks. Uncertainty around Federal Reserve policy added another layer of stress on balance-sheet strategies built around digital assets, and a few firms found themselves explaining awkward quarterly numbers to shareholders who’d bought into the treasury story a little too enthusiastically.
This episode says something about how far Bitcoin’s role has come. It now sits alongside other risk assets in corporate financial planning, rather than functioning as a purely speculative side bet.
What the Data Suggests Looking Ahead
Put it all together, ETF outflows, on-chain capitulation, cycle compression, corporate rebalancing, and a picture starts to form. It’s a market working through a genuine post-peak adjustment, not a market in freefall. Framing from NYDIG describes 2026 as a shift into a post-narrative cycle, where volatility compresses structurally and institutions start treating Bitcoin more like a balance-sheet risk asset comparable to commodities.
A few signs would suggest the bottoming process is further along than it appears. Cooling long-term holder loss realization is one. Any stabilization or return of ETF inflows would be another. Price reclaiming key cost-basis levels would round things out. Historical patterns following past halvings have often included multi-month consolidation before new macro floors took hold, so there’s precedent for patience here.
Whether the bottom is fully in remains an open question, and probably will for a while yet. But the accumulating data offers more useful waypoints than any single headline is likely to provide. Staying focused on liquidity metrics and on-chain redistribution will probably serve better than chasing whatever narrative happens to be trending this week.